Colour & Shape: Using Computer Vision to Explore the Science Museum Group Collection | by Cath Sleeman
Unique individual objects
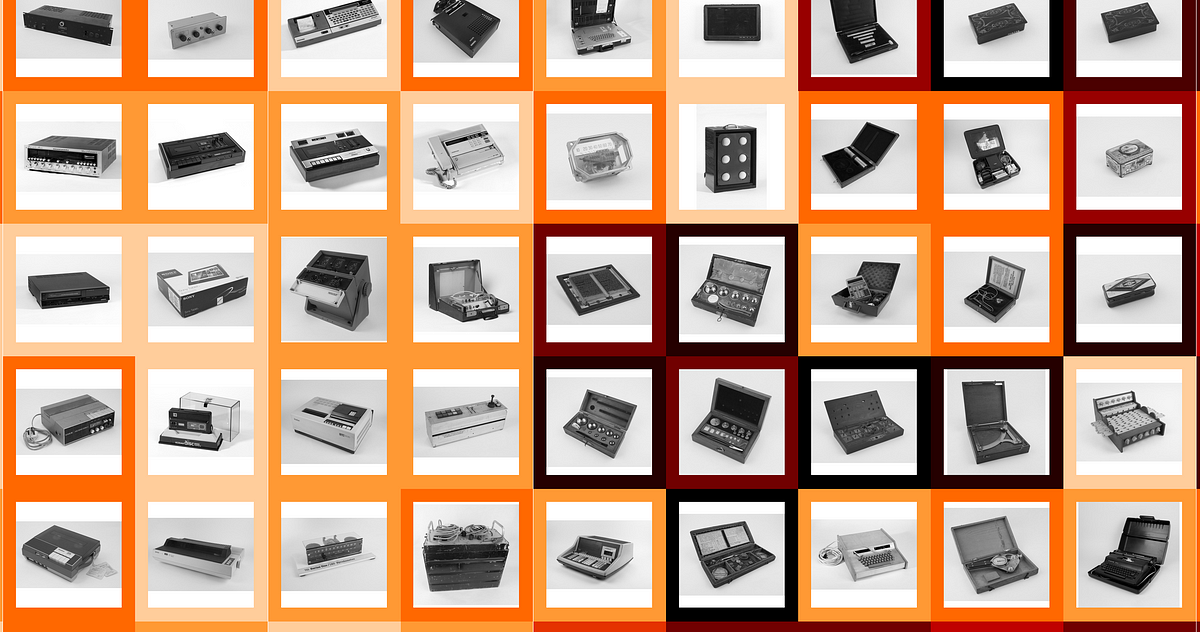
In addition to finding unique groups of objects, the map can also be used to identify individual objects that have a highly distinctive appearance. A selection of these objects are shown below. They were found by measuring the distance of each object to its five nearest neighbours.

The collage includes several domestic appliances: a marmalade cutter, a heater designed to recycle waste hot air from a fireplace, and a rotary cheese grater. There are also two art deco objects: a photo frame and a loudspeaker. And there are two Kinora viewers, which are similar to ‘flip books’. The user looks through a viewer while turning a handle which causes the picture to flip over.
Perhaps the two oddest objects are the sample of turf and what appears to be a blue rock. These two objects are connected because they both relate to recycling. The artificial turf is an example of a product made from recycling old Nike shoes. And the blue rock is actually broken and scrap glass (called cullet) which is added to the furnace when making new glass. It is a way of recycling the glass and it speeds up the process, thereby saving on fuel.

The Science Museum Group’s open dataset of photographs allows us to learn more about their collection. Our preliminary analysis suggests that everyday objects may have become a little greyer and a little squarer over time. While only time will tell, it does highlight a challenge for museums who must engage visitors with these ‘black boxes’. Collectively examining objects also allows us to identify and celebrate the most distinctive objects, from typewriters to table telephones. And it lets us spot small patterns that we might have otherwise missed, such as the bright blues within 19th century pocket watches. As computer vision methods continue to improve we will be able to extract further insights from online collections and learn more about the objects that fill our lives.

The aim of this piece was to show the value of online collections and to encourage the exploration of other online collections. Before launching such an exploration, there are several challenges to bear in mind, which we describe below.
First, it may not be possible to analyse an entire collection. Not every object within the Science Museum Group Collection has been photographed, and others have only been captured in black-and-white. We also had to exclude any photograph whose background colour was not uniform. In these photographs it is too difficult to accurately distinguish the colour of the object from its background. Non-uniform backgrounds tended to arise where the object was large (such as a machine) and the photograph had been taken in situ. The uniformity of the background colour was judged by measuring the variation in colour around the very edge of the photograph.
A second challenge is accurately identifying the colours of an object within a photograph, and excluding background colours. We did this by extracting every pixel from a photograph and then dropping any pixel whose colour was too close to the most common edge colour. This approach presumes that the object itself never touches the edge of the photograph. The key variable is the threshold distance below which a pixel is considered to be ‘too close’ to the background and dropped. If the threshold is set too high we may be underestimating the amount of near off-white colours within objects (most backgrounds are white). If the threshold is set too low we may accidentally include some of the background colour in our analysis. For some parts of the analysis we also had to round the colours, to reduce the number of unique colours and allows us to display them in the charts.
The third challenge relates to measuring the similarity of objects, or more accurately, the similarity of their photographs. We used a convolutional neural network model (VGG16) to extract feature vectors for each image. The dimensionality of these vectors was reduced using Principal Components Analysis (PCA), followed by t-Distributed Stochastic Neighbour Embedding (t-SNE). These give a simplified approximation of each object and they don’t account for the scale of an object; objects of different sizes (but related outlines) may be judged as being similar to each other. In order to clearly display the t-SNE mapping the images were placed into a grid. The placement of objects within the grid aimed to minimise the distance of the object from its true location, but there will be some distortion (particularly in dense areas where there are many similar objects).
Finally, there are two broader points to consider. The colour of an object will be influenced by its surroundings, how it is displayed and how it is photographed. Two photographs of the same object, from different angles or against different backgrounds, may generate different colour profiles. And it is important to remember that the results shown above will continue to change as the collection evolves, and as more objects within the collection are photographed.