A look back at the Iberian power outage of April 28
By Philip Tellis on
Table of Contents
On Monday this week, the Iberian Peninsula suffered a major power outage
that disabled many services across these countries. In this post I’ll look at the patterns we saw in
mPulse data during this time.
Overall traffic
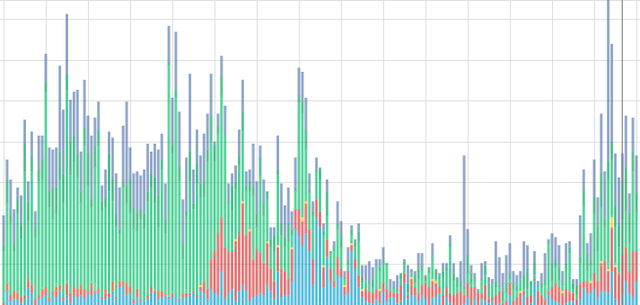
I first looked at the overall data patterns for traffic originating from Spain & Portugal for several weeks prior to the outage.
While other regions
were also
slightly affected, these two countries
suffered the worst of it.

The image above shows traffic patterns for these two countries for 7 days around the event at 1 hour granularity. We see that on average (in that mode I mean the medians),
Spain has about 4.5 times the traffic of Portugal. This is expected, since Spain’s population (48m) is 4.5 times that of Portugal (10.5).
Identifying the Anomaly
I then ran mPulse’s Anomaly Detection against this data.

The Anomaly Detection logic shows that traffic dropped below expected levels between 12pm & 1pm CEST (local time in Madrid),
and then returned to normal sometime around 2am on the 29th. This chart only shows traffic from Spain, but you get the picture.
Drilling into the details
I then looked at the data at finer granularity. This time at 5 minute intervals comparing April 28th to the week prior. Ideally I’d have used the previous Monday, but as that
was the Easter Monday holiday, the traffic patterns were unusual on that day as well. I settled on Wednesday, April 23rd as a representative day for the prior week. Just to be
sure, I also looked at data from France & Germany to make sure we weren’t seeing a common change in pattern.
Also, to be clear, for any of the following charts that refer to a single country, the time axis will be in that country’s time zone. This means that Portugal shows up in
WEST rather than CEST.
The outage started at 11:33am in Portugal which is 12:33pm in Spain.
I looked at several different dimensions, but the first one to stand out was Device Type.
Mobile Lunches
For all 4 countries that I looked at, there is a sharp drop in desktop traffic around lunch time. France and Portugal have a 2 hour lunch break from about 12-2pm. Germans take
a 1 hour lunch from 12-1pm. Spaniards have a later lunch, starting around 1pm, and going on until 4 or 5pm. This could possibly be due to the tradition of afternoon
siesta.
During this lunch break, we see traffic moving to mobile devices.


During the outage
At the start of the power outage, we notice that while traffic drops 80% on desktop, there is only a 40% drop on mobile. At this time, and going on for a few hours,
there is more mobile traffic than desktop traffic. In fact mobile traffic remains higher than desktop traffic until the next morning, but this appears to be a common
pattern where traffic typically moves to mobile as people leave work around 5pm.
I was curious about that intial part of the outage. If there wasn’t power, then how were people still connecting to the Internet? Naturally their phones still had sufficient
battery power, but were there cell phone signals or other networks that were usable?
Connection sources
For these charts I looked only at mobile devices to see how they were connecting to the Internet.


For both Spain & Portugal, we see that Wired connections (this includes WiFi you may have at home, the office or a coffee shop since it uses NAT
over a wire, but not ISP provided WiFi networks where you get a public IP over WiFi) drop off significantly. There’s about a 50 percentage point drop in wired traffic. At
the same time, Portugal saw a 30 percentage point increase in Cellular network usage. There were even a few wireless hotspots that appear at this time.
Destinations
What kinds of sites were most interesting at this time? What were people willing to use their limited electric reserves on? I grouped destination sites by Industry to
try and make some sense of it.
There are different patterns for Spain & Portugal, so I’ll look at them separately.

Remember that in Portugal the outage started at 11:33am local time. Almost immediately we see an increase in traffic to news websites with people trying to find out
what was going on. There are also periodic updates on government websites that see an increase in traffic.
There’s a drop in Retail, Entertainment and Financial activity.
There is also a sudden new stream of visits to sites dealing with Food Safety and the safe handling of food, possibly because people have to figure out what’s safe to hold
on to without refrigeration. I should mention that there were no visits to these sites at any time prior to this event for the several weeks that I looked at the data.
Food safety and Government websites seem to be common with Spain as well.

However Spanish users do not visit news websites as much. Most of their information comes from government websites.
I also found the steady stream of travel websites interesting. People needed to know if the outage affected their travel plans.
How long could it last?
Finally I wanted to know how long folks could keep using the Internet from their phones, so I looked at battery percentage data. One caveat is that we do not have battery
data from all users, so this is a much smaller sample. Once again, I compared the data during the outage with the previous week, and also with other countries in Europe
to make sure we weren’t catching common patterns.

For other countries in the EU, we see that the change in battery levels is consistent week over week.

For Spain & Portugal, we see a deviation from the prior week’s pattern just as the outage starts. At the peak of the outage, phone battery levels are about 10 percentage points
lower than the week prior. As partial power starts to come back, first in Portugal, and then in Spain, we see levels get back to the previous week’s pattern.
There’s another minor drop later at night when more power is restored and more people start to come online, but things start to normalize soon after that.
In closing
This is one of the few posts I’ve written that doesn’t directly talk about any of the performance metrics we collect. I did look at the change in network latency during the
event, but all visible effects appeared to be a side-effect of reduced traffic. It’s important to look at traffic as well as other metrics because you do need a large enough
sample to have stability in everything else.
In a world that’s so dependent on having access to electricity, it’s interesting to see how some information services were still able to stay online and available. These sites
were served by Akamai, and having battery backups, generators, and edge nodes geographically dispersed helps our customers stay online during local events like these.