
What a Year of Solar and Batteries Really Saved Us in 2025
Throughout 2025, I spoke a few times about our home energy solution, including our grid usage, our solar array and our Tesla Powerwall batteries. Now that I have a full year of data, I wanted to take a look at exactly how everything is working out, and, in alignment with our objectives, how much money we’ve saved!
Our setup
Just to give a quick overview of what we’re working with, here are the details on our solar, battery and tariff situation:
- ☀️Solar Panels: We have 14x Perlight solar panels managed by Enphase that make up the 4.2kWp array on our roof, and they produce energy when the sun shines, which isn’t as often as I’d like in the UK!
- 🔋Tesla Powerwalls: We have 3x Tesla Powerwall 2 in our garage that were purchased to help us load-shift our energy usage. Electricity is very expensive in the UK and moving from peak usage which is 05:30 to 23:30 at ~£0.28/kWh, to off-peak usage, which is 23:30 – 05:30 at ~£0.07/kWh, is a significant cost saving.
- 💡Smart Tariff: My wife and I both drive electric cars and our electricity provider, Octopus Energy, has a Smart Charging tariff. If we plug in one of our cars, and cheap electricity is available, they will activate the charger and allow us to use the off-peak rate, even at peak times.
Now that we have some basic info, let’s get into the details!
Grid Import
I have 3 sources of data for our grid import, and all of them align pretty well in terms of their measurements. I have the amount our electricity supplier charged us for, I have my own CT Clamp going via a Shelly EM that feeds in to Home Assistant, and I have the Tesla Gateway which controls all grid import into our home.
Starting with my Home Assistant data, these are the relevant readings.
Jan 1st 2025 – 15,106.10 kWh
Dec 31st 2025 – 36,680.90 kWh
Total: 21,574.80 kWh
Total Import: 21.6 MWh
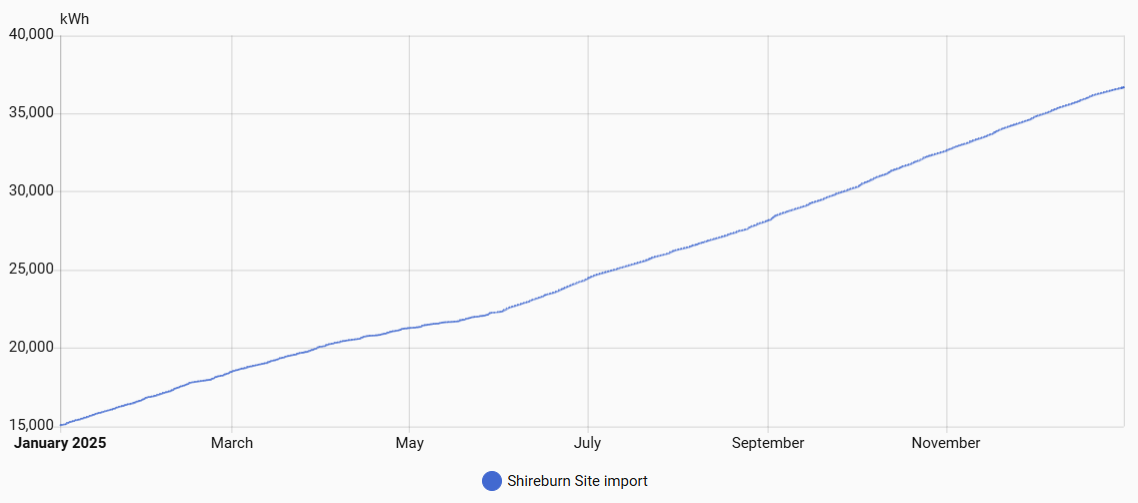
As you can see in the graph, during the summer months we have slightly lower grid usage and the graph line climbs at a lower rate, but overall, we have pretty consistent usage. Looking at what our energy supplier charged, us for, that comes in slightly lower.
Total Import: 20.1 MWh
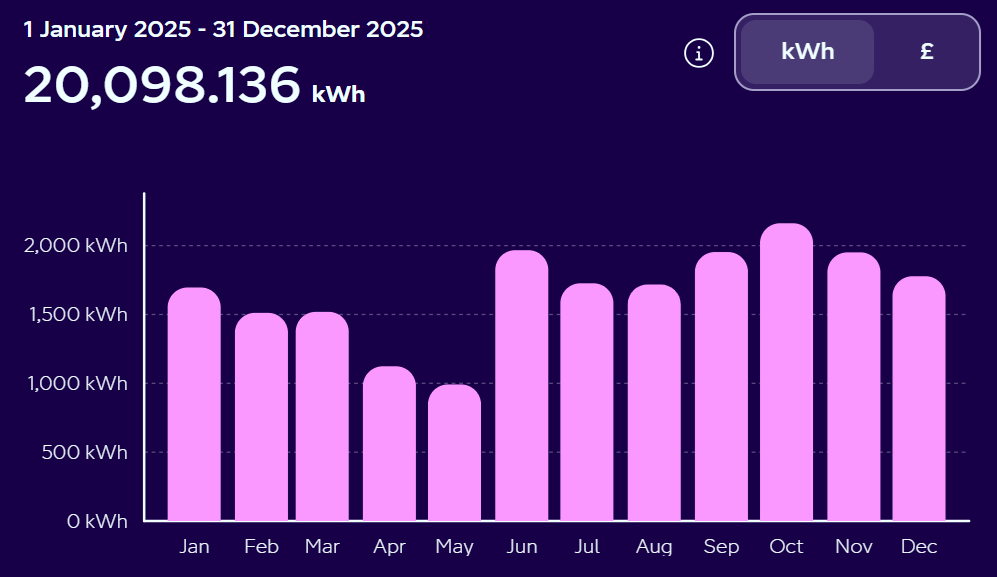
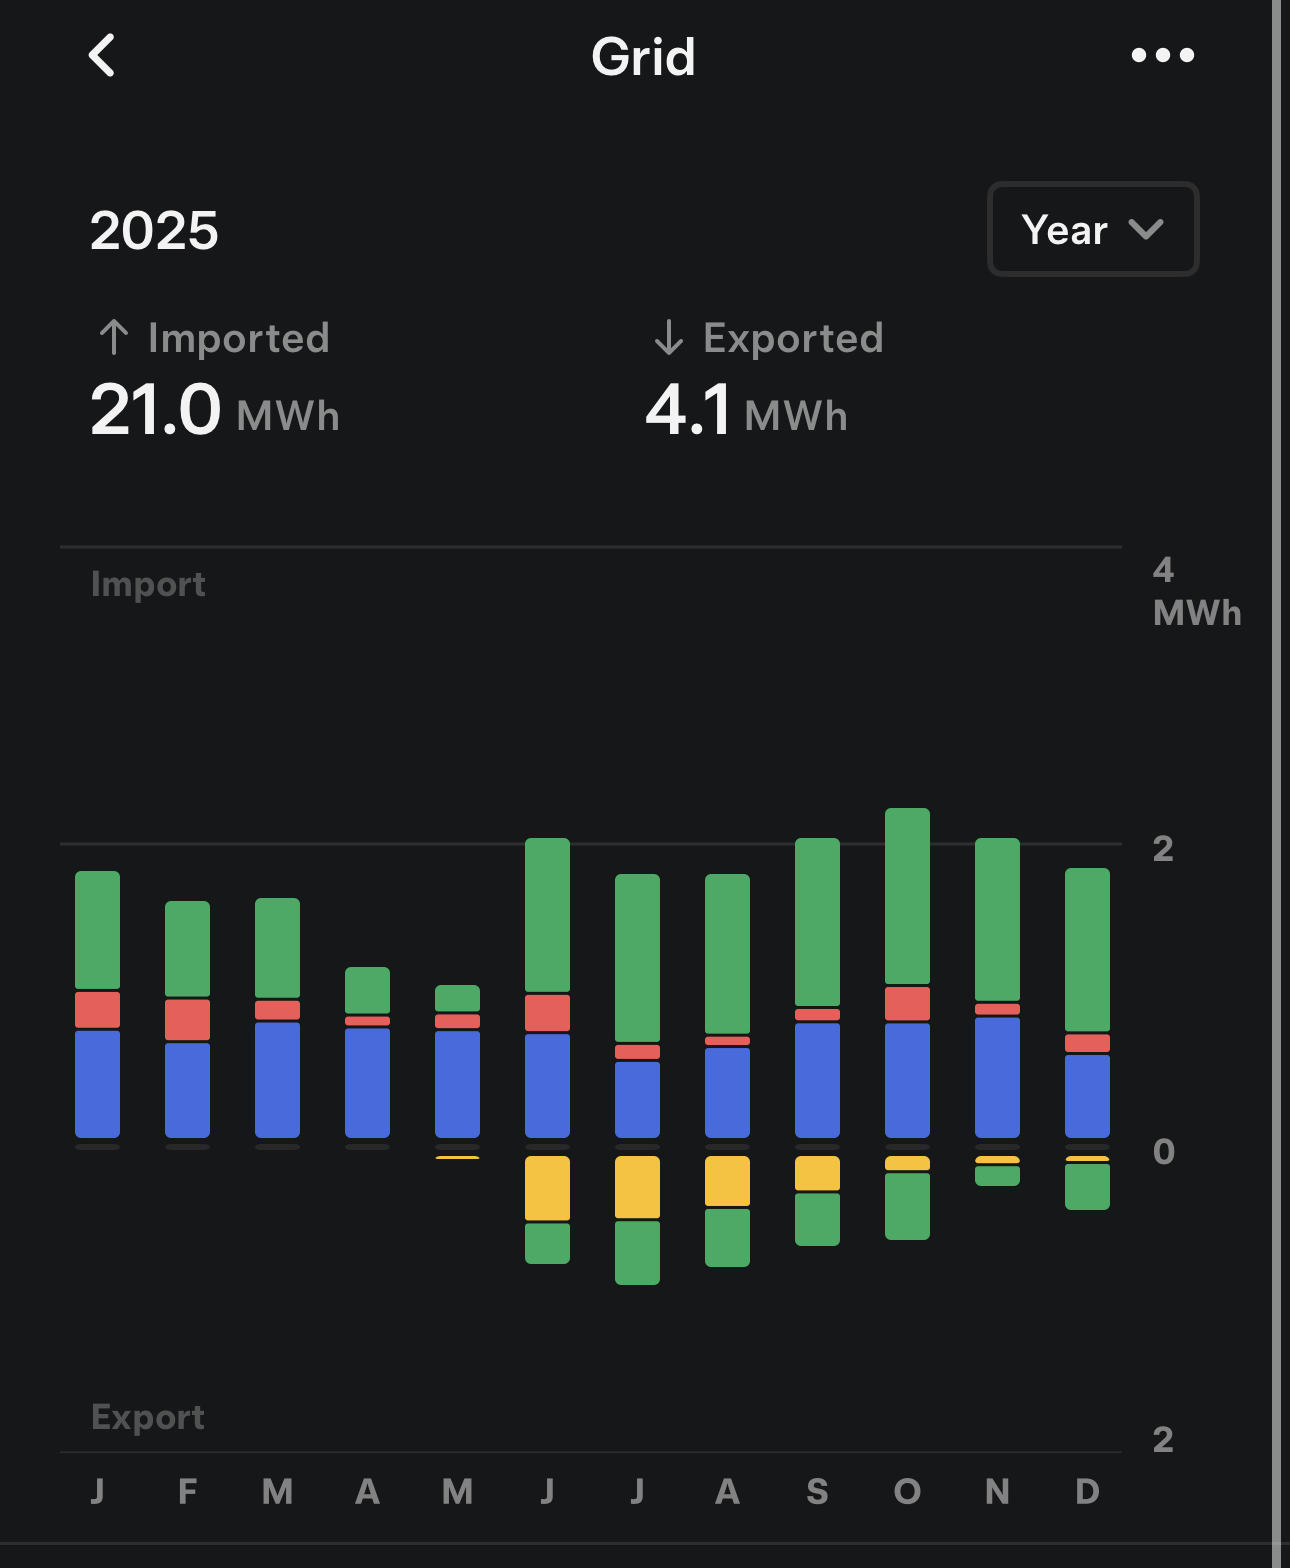
I’m going to use the figure provided by our energy supplier in my calculations because their equipment is likely more accurate than mine, and also, what they’re charging me is the ultimate thing that matters. The final source is our Tesla Gateway, which shows us having imported 21.0 MWh.
It’s great to see how all of these sources of data align so poorly! 😅
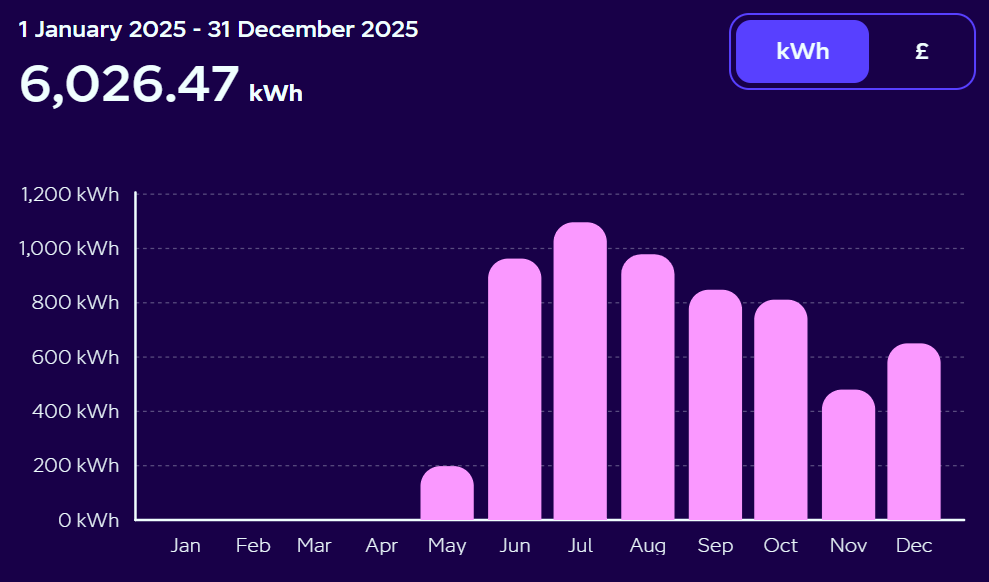
Grid Export
Looking at our export, the graph tells a slightly different story because, as you can see, we didn’t really start exporting properly until June, when our export tariff was activated. Prior to June, it simply wasn’t worth exporting as we were only getting £0.04/kWh but at the end of May, our export tariff went live and we were then getting paid £0.15/kWh for export. My first and second blog posts cover the full details of this change when it happened if you’d like to read them but for now, just note that it will change the calculations a little later as we only had export for 60% of the year.
Total Export: 6.0 MWh
With our grid export covered the final piece of the puzzle is to look at our solar.
Solar Production
We’re really not in the best part of the world for generating solar power, but we’ve still managed to produce quite a bit of power. Even in the most ideal, perfect scenario, our solar array can only generate 4.2kW of power, and we’re definitely never getting near that. Our peak production was 2.841kW on 8th July at 13:00, and you can see our full annual production graph here.
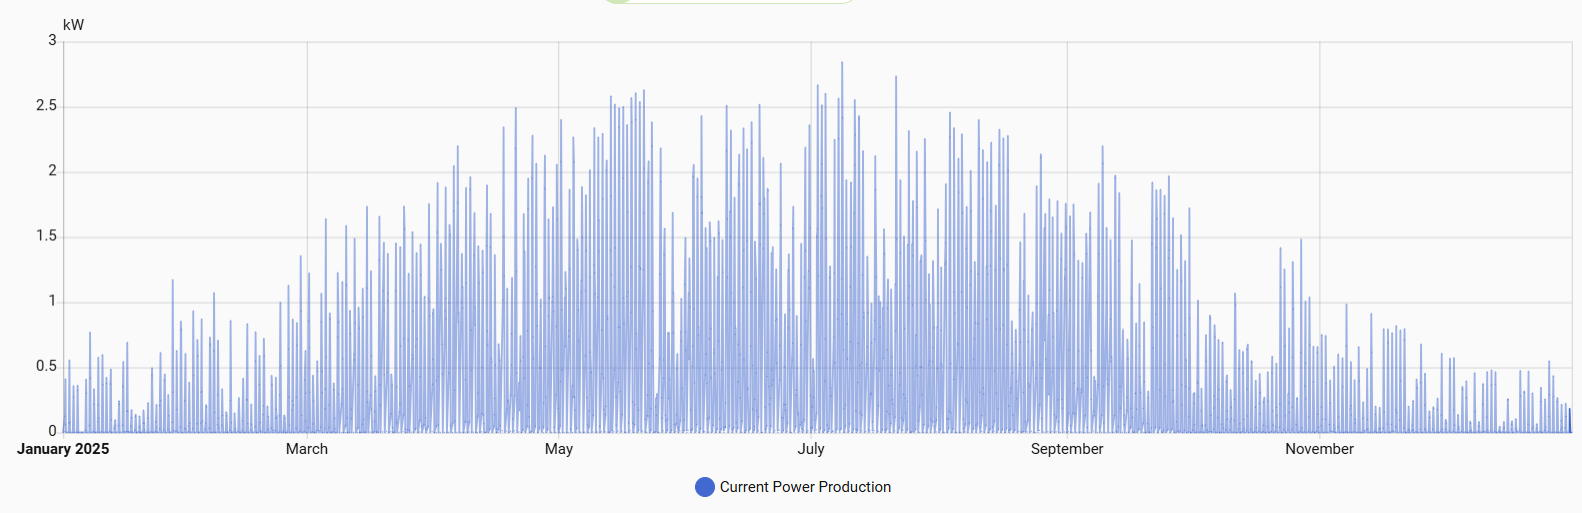
Looking at the total energy production for the entire array, you can see it pick up through the sunnier months but remain quite flat during the darker days of the year.
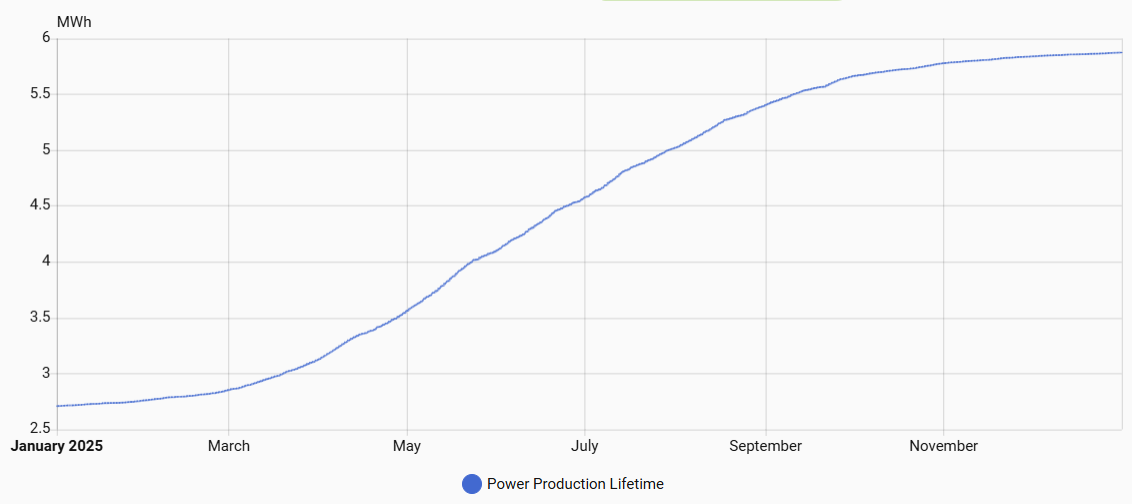
Jan 1st 2025 – 2.709 MWh
Dec 31st 2025 – 5.874 MWh
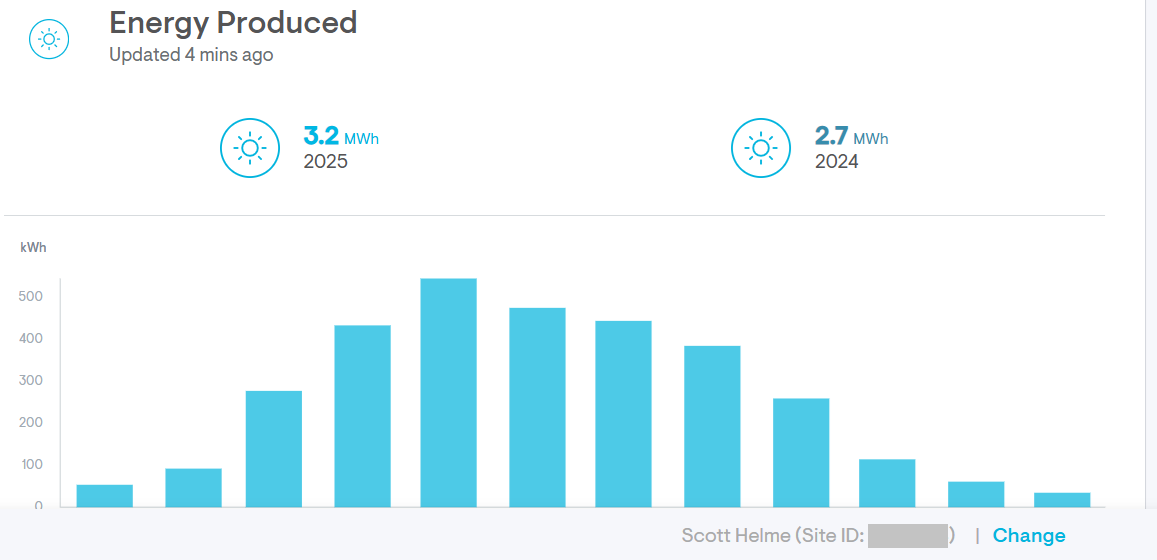
Solar Production: 3.2 MWh
Just to confirm, I also took a look at the Enphase app, which is drawing it’s data from the same source to be fair, and it agrees with the 3.2 MWh of generation.
Calculating the savings
This isn’t exactly straightforward because of the combination of our solar array and excess import/export due to the batteries, but here are the numbers I’m currently working on.
Total Import: 20.1 MWh
Total Export: 6.0 MWh
Solar Production: 3.2 MWh
That gives us a total household usage of 17.3 MWh.
(20.1 MWh import + 3.2 MWh solar) − 6.0 MWh export = 17.3 MWh usage
If we didn’t have the solar array providing power, the full 17.3 MWh of consumption would have been chargeable from our provider. If we had only the solar and no battery, assuming a perfect ability to utilise our solar generation, only 14.1 MWh of our usage would need to be imported. The cost of those units of solar generation can be viewed at the peak and off-peak rates as follows.
Peak rate: 3,200 kWh x £0.28/kWh = £896
Off-peak rate: 3,200 kWh x £0.07/kWh = £224
Given that solar panels only produce during peak electricity rates, it would be reasonable to use the higher price here. A consideration for us though is that we do have batteries, and we’re able to load-shift all of our usage into the off-peak rate, so arguably the solar panels only made £224 of electricity.
The bigger savings come when we start to look at the cost of the grid import. Assuming we had no solar panels, we’d have imported 17.3 MWh of electricity, and with the solar panels and perfect utilisation, we’d have imported 14.1 MWh of electricity. That’s quite a lot of electricity and calculating the different costs of peak vs. off-peak by using batteries to load shift our usage gives some quite impressive results.
Peak rate: 17,300 kWh x £0.28/kWh = £4,844
Peak rate with solar: 14,100 kWh x £0.28 = £3,948
Off-peak rate: 17,300 kWh x £0.07/kWh = £1,211
Off-peak rate with solar: 14,100 kWh x £0.07/kWh = £987
This means there’s a potential swing from £4,844 down to £987 with solar and battery, a total potential saving of £3,857!
This also tracks if we look at our monthly spend on electricity which went from £350-£400 per month down to £50-£100 per month depending on the time of year. But it gets better.
Exporting excess energy
Our solar array generates almost nothing in the winter months so our batteries are sized to allow for a full day of usage with basically no solar support. We can go from the start of the peak rate at 05:30 all the way to the off-peak rate at 23:30 without using any grid power. When it comes to the summer months, though, our solar array is producing a lot of power and we clearly have a capability to export a lot more. The batteries can fill up on the off-peak rate overnight at £0.07/kWh, and then export it during the peak rate for £0.15/kWh, meaning any excess solar production or battery capacity can be exported for a reasonable amount.
If we take a look at the billing information from our energy supplier, we can see that during July, our best month for solar production, we exported a lot of energy. We exported so much energy that it actually fully offset our electricity costs and allowed us to go negative, meaning we were earning money back.
Here is our electricity import data:
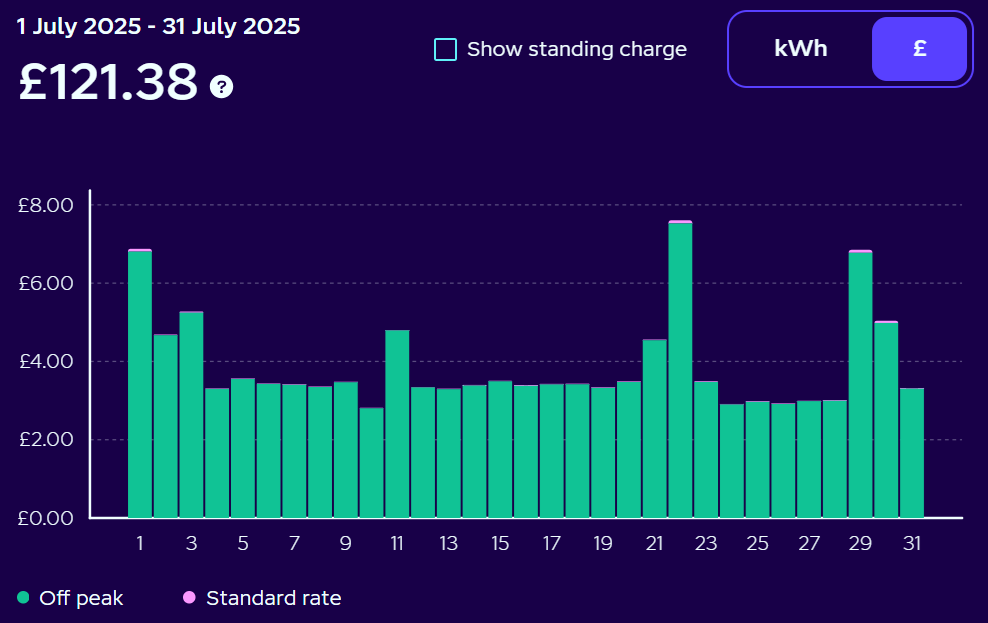
And here is our electricity export data:
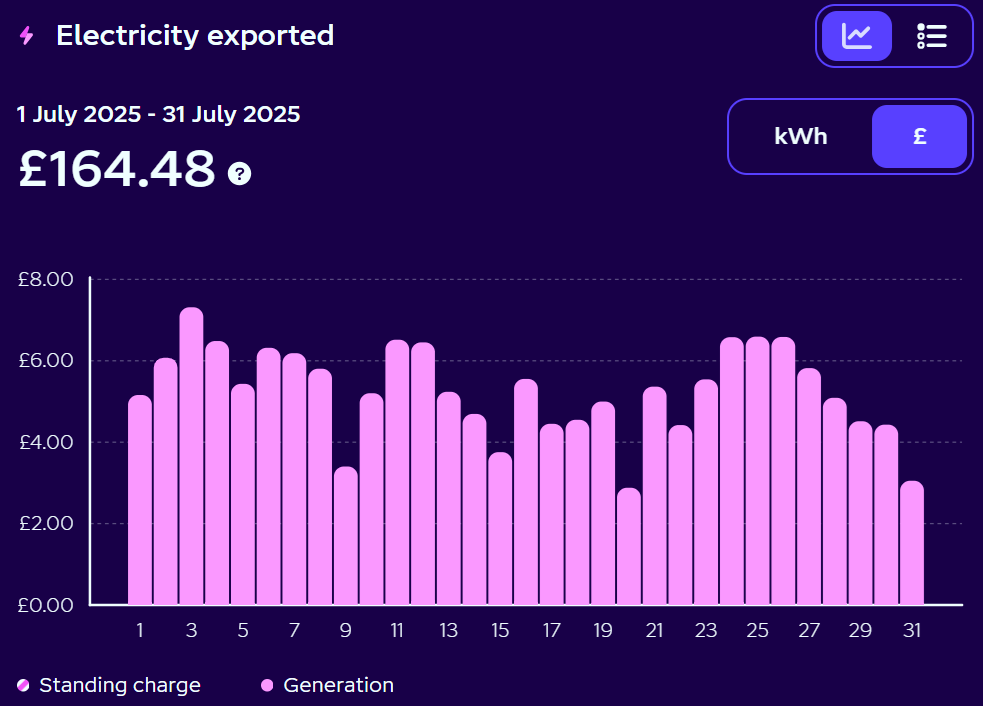
That’s a pretty epic scenario, despite us being such high energy consumers, to still have the ability to full cover our costs and even earn something back! For clarity, we will still have the standing charge component of our bill, which is £0.45/day so about £13.50 per month to go on any given month, but looking at the raw energy costs, it’s impressive.
The final calculation
I pulled all of our charges for electricity in 2025 to see just how close my calculations were and to double check everything I was thinking. Earlier, I gave these figures:
Off-peak rate: 17,300 kWh x £0.07/kWh = £1,211
If 100% of our electricity usage was at the off-peak rate, we should have paid £1,211 for the year. Adding up all of our monthly charges, our total for the year was £1,608.11 all in, but we need to subtract our standing charge from that.
Total cost = £1,608.11 – (365 * £0.45)
Total import = £1,443.86
This means that we got almost all of our usage at the off-peak rate which is an awesome achievement! After the charges for electricity, I then tallied up all of our payments for export.
Total export = £886.49
Another pretty impressive achievement, earning so much in export, which also helps to bring our net electricity cost in 2025 to £557.37! To put this another way, the effective rate of our electricity is now just £0.03/kWh.
£557.37 / 17,300kWh = £0.03/kWh
But was it all worth it?
That’s a tricky question to answer, and everyone will have different objectives and desired outcomes, but ours was pretty clear. Running two Electric Vehicles, having two adults working from home full time, me having servers and equipment at home, along with a power hungry hot tub, we were spending too much per month in electricity alone, and our goal was to reduce that.
Of course, it only makes sense to spend money reducing our costs if we reduce them enough to pay back the investment in the long term, and things are looking good so far. Here are the costs for our installations:
£17,580 – Powerwalls #1 and #2 installed.
£13,940 – Solar array installed.
£7,840 – Powerwall #3 installed.
Total cost = £39,360
If we assume even a generous 2/3 – 1/3 split between peak and off-peak usage, with no Powerwalls or solar array, our electricity costs for 2025 would have been £3,632.86:
11,533 kWh x £0.28/kWh = £3,229.24
5,766 kWh x £0.07/kWh = £403.62
Total = £3,632.86
Instead, our costs were only £557.37, meaning we saved £3,078.49 this year. We also only had export capabilities for 7 months of 2025, so in 2026 when we will have 12 months of export capabilities, we should further reduce our costs. I anticipate that in 2026 our electricity costs for the year will be ~£0, and that’s our goal.
Having our full costs returned in ~11 years is definitely something we’re happy with, and we’ve also had protection against several power outages in our area along the way, which is a very nice bonus. Another way to look at this is that the investment is returning ~9%/year.
| Year | Cumulative savings (£) | ROI (%) |
|---|---|---|
| 1 | 3,632.86 | 9.23% |
| 2 | 7,265.72 | 18.46% |
| 3 | 10,898.58 | 27.69% |
| 4 | 14,531.44 | 36.92% |
| 5 | 18,164.30 | 46.15% |
| 6 | 21,797.16 | 55.38% |
| 7 | 25,430.02 | 64.61% |
| 8 | 29,062.88 | 73.84% |
| 9 | 32,695.74 | 83.07% |
| 10 | 36,328.60 | 92.30% |
| 15 | 54,492.90 | 138.43% |
| 20 | 72,657.20 | 184.61% |
| 25 | 90,821.50 | 230.76% |
Of course, at some point during that period, the effective value of the installation will reduce to almost £0, and we have to consider that, but it’s doing pretty darn good. If we hadn’t needed to add that third Powerwall, this would have been so much better too. We’ll see what the future holds, but with the inevitable and continued rise of energy costs, and talk of moving the standing charge on to our unit rate, things might look even better in the future.
Onwards to 2026!
Now that we have everything properly set up, and I’m happy with all of our Home Assistant automations, we’re going to see how 2026 goes. I will definitely circle back in a year from now and see how the numbers played out, and until then, I hope the information here has been useful or interesting 👍